Tiếng Việt


Overview of Vietnam logistics
Video of the article
General information about Vietnam
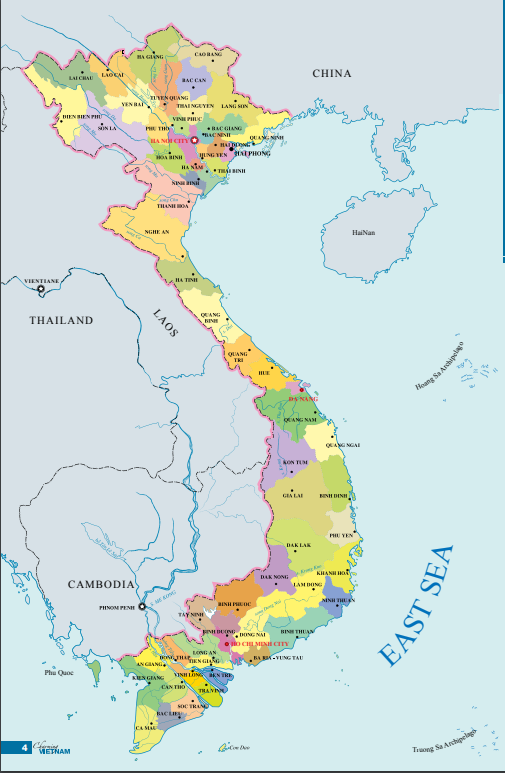
Vietnam Geography: Vietnam is located on the eastern margin of the Indochinese peninsula, It borders the Gulf of Thailand, Gulf of Tonkin, and Pacific Ocean, along with China, Laos, and Cambodia
- Official name: The Socialist Republic of Viet Nam.
- National Day: September 2 (on September 2, 1945, at Ba Dinh square, President Ho Chi Minh read the Declaration of Independence, proclaiming the birth of the Democratic Republic of Viet Nam). Geographical location: Located in Southeast Asia, bordering People’s Republic of China to the North; Laos and Cambodia to the West; and Eastern Sea to the East.
- Area: 331 000 km².
- Length of coast line: 3260 km.
- Climate: Tropical monsoon.
- Capital: Ha Noi.
- Official language: Vietnamese.
- Population:
- Population: Population: is 99 Million in 2023 (1.24% of the world)
- Currency: Viet Nam Dong (VND).
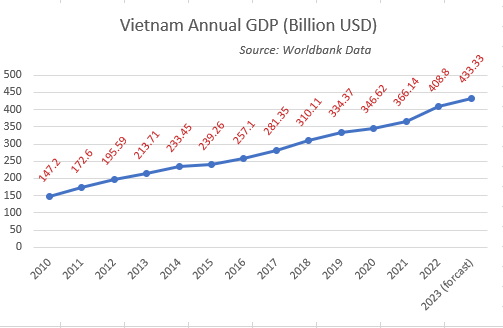
- GDP (nominal): US$ 409 billion USD (according to Worldbank)
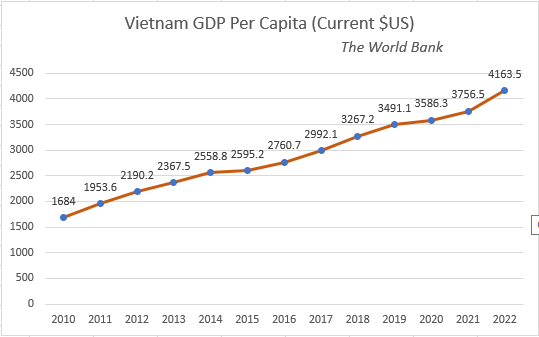
- GDP per capita (nominal): US$ 4163, ranking 117 in the world (according to IMF)
- Administrative units: 63 provinces and cities (in 2023)
Overview of Vietnam Economy
As evaluated by The World Bank: “Over the past 30 years, Vietnam has had a remarkable development record. Economic and political reforms under Đổi Mới, launched in 1986, have spurred rapid economic growth and development and transformed Vietnam from one of the world’s poorest nations to a lower middle-income country”
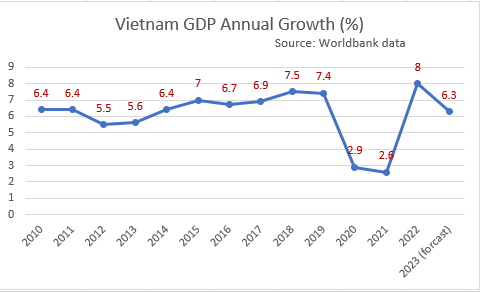
Viet Nam has sustained economic growth at a relatively high level in many consecutive years.
Vietnam and the world
Vietnam has integrated widely and deeply into the world economy.
At Feburuary 2023, Vietnam has established its diplomatic relations with 192 countries (in which 190/193 members of the UN. It has built a network of strategic partnerships with 17 countries, in wich 4 are comprehensive strategic partnerships.
Vietnam’s admission to ASEAN in July 1995 was a milestone in Vietnam’s integration process. Vietnam joined the Asia-Europe Meeting (ASEM) one year later and the Asia-Pacific Economic Cooperation (APEC) in 1998. The country’s membership of the World Trade Organization (WTO) in January 2007 marked Vietnam’s full integration in international institutions. In 2015, Vietnam and other ASEAN members formed an ASEAN Community. Currently, Vietnam is a active members of over 70 regional and international organizations
Up to 2023, Vietnam have agreement on the most favoured-nation (MFN) and preferential treatment in trade relations with 172 countries and territories
Details list, see in the article: List of Countries and Territories Having MFN With Vietnam
-> for more details, see: Overview Of Trade Relations Between Vietnam And The World
Vietnam and FTAs:
With the completion of 18 FTAs by 2023, Vietnam have joined Free Trade Agreement with 57 countries and territories in the world. Vietnam’s export markets have been expanded to 230 countries and territories.
- List of FTA Vietnam Join can be find at the article: List of FTA Vietnam Joined
- List of countries/territories those have free trade agreements with Vietnam
Vietnam Import and Export
Import – Export turnover
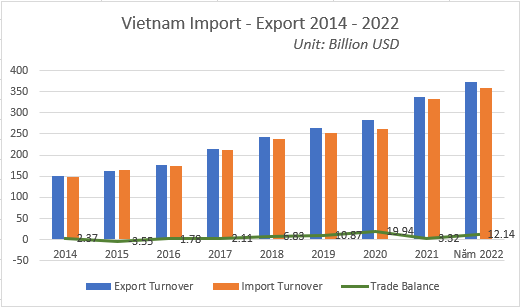
VIETNAM IMPORT – EXPORT TURNOVER AND TRADE BALANCE PERIOD 2014 – 2022
Unit: Billion USD
| 2014 | 2015 | 2016 | 2017 | 2018 | 2019 | 2020 | 2021 | 2022 | |
| Export Turnover | 150.22 | 162.02 | 176.58 | 215.12 | 243.7 | 264.27 | 282.63 | 336.17 | 371.72 |
| Import Turnover | 147.85 | 165.57 | 174.8 | 213.01 | 236.87 | 253.39 | 262.69 | 332.84 | 359.58 |
| Trade Balance | 2.37 | -3.55 | 1.78 | 2.11 | 6.83 | 10.87 | 19.94 | 3.32 | 12.14 |
Source: Compiled from data provided by the General Department of Vietnam Customs
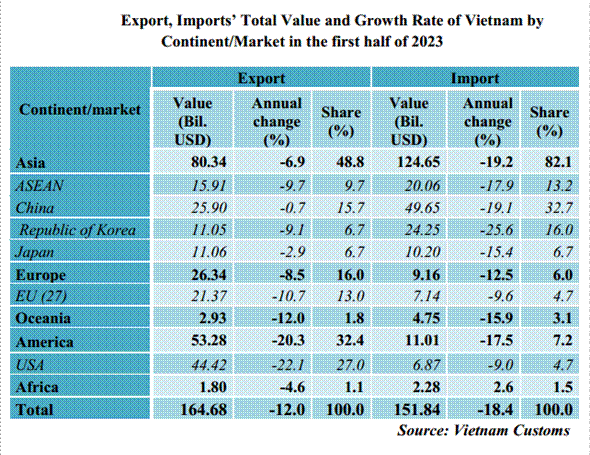
Import – Export Market
Vietnam Export
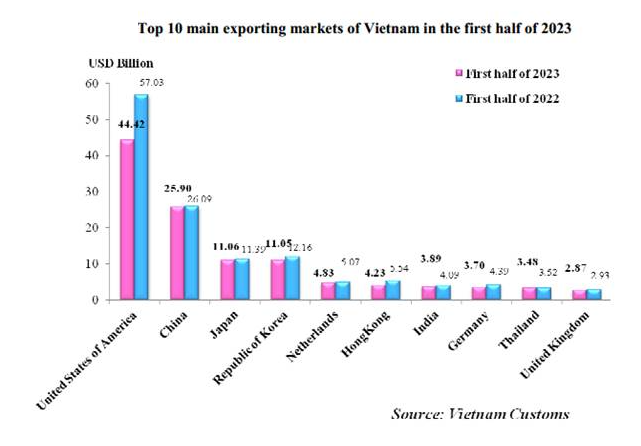
STATISTICS OF VIETNAM MAIN EXPORTS FIRST 6 MONTHS 2023
| No. | Main exports | Units | First 6 months 2023 | Compared with previous year (%) | ||
| Volume | Value (USD) | Volume | Value | |||
| TOTAL VALUE | USD | 164,680,895,169 | -12.0 | |||
| 1 | Computers, electrical products, spare-parts and components thereof | USD | 25,586,743,233 | -7.9 | ||
| 2 | Telephones, mobile phones and parts thereof | USD | 24,200,348,937 | -18.2 | ||
| 3 | Machine, equipment, tools and instruments | USD | 19,700,458,472 | -8.3 | ||
| 4 | Textiles and garments | USD | 15,729,575,624 | -15.4 | ||
| 5 | Foot-wears | USD | 9,821,814,221 | -16.8 | ||
| 6 | Other means of transportation, parts and accessories thereof | USD | 6,674,883,179 | 15.7 | ||
| 7 | Wood and wooden products | USD | 6,056,570,239 | -28.3 | ||
| 8 | Iron and steel | Ton | 5,386,412 | 4,257,501,851 | 12.2 | -14.6 |
| 9 | Fishery products | USD | 4,146,042,273 | -27.1 | ||
| 10 | Fruits and vegetables | USD | 2,680,936,652 | 60.1 | ||
| 11 | Still image, video cameras and sparts thereof | USD | 2,670,756,041 | -3.0 | ||
| 12 | Coffee | Ton | 1,006,959 | 2,390,290,174 | -3.1 | 2.3 |
| 13 | Plastic products | USD | 2,385,092,884 | -18.5 | ||
| 14 | Rice | Ton | 4,237,738 | 2,256,854,011 | 21.3 | 32.2 |
| 15 | Other base metals and other base metal products | USD | 2,149,331,169 | -12.5 | ||
| 16 | Yarn | Ton | 832,273 | 2,063,717,290 | -2.5 | -25.6 |
| 17 | Iron and steel products | USD | 2,046,700,292 | -15.3 | ||
| 18 | Handbags, purses, suit-cases, headgear and umbrellas | USD | 1,816,919,261 | -10.6 | ||
| 19 | Toys and sports requisites; parts and accessories thereof | USD | 1,773,947,586 | -9.3 | ||
| 20 | Cashew nut | Ton | 279,428 | 1,635,364,003 | 11.9 | 8.8 |
| 21 | Insulated wires and cables | USD | 1,596,764,613 | -4.3 | ||
| 22 | Chemicals | USD | 1,221,291,628 | -25.6 | ||
| 23 | Chemical products | USD | 1,192,935,627 | 1.6 | ||
| 24 | Furnitures of other materials, other than of wood | USD | 1,185,230,259 | -25.3 | ||
| 25 | Paper and paper products | USD | 1,052,944,363 | 11.1 | ||
| 26 | Rubber | Ton | 765,374 | 1,048,495,638 | -2.7 | -23.0 |
| 27 | Plastics | Ton | 880,058 | 1,027,349,736 | 7.2 | -19.3 |
| 28 | Textile, leather and foot-wear materials and auxiliaries | USD | 958,567,121 | -18.6 | ||
| 29 | Crude oil | Ton | 1,418,400 | 939,450,647 | 13.7 | -13.8 |
| 30 | Petroleum products | Ton | 1,144,398 | 936,687,845 | 6.6 | -8.5 |
| 31 | Clinker and cement | Ton | 15,742,098 | 684,219,471 | -6.7 | -7.2 |
| 32 | Precious stones, precious metal and articles thereof | USD | 593,849,024 | 10.4 | ||
| 33 | Manioc and manioc products | Ton | 1,501,584 | 593,847,059 | -13.4 | -21.2 |
| 34 | Animal fodders and animal fodder materials | USD | 522,337,857 | -12.2 | ||
| 35 | Rubber products | USD | 515,144,638 | -9.0 | ||
| 36 | Pepper | Ton | 152,678 | 483,169,239 | 23.6 | -13.7 |
| 37 | Pastrycooks, sweets and cereals products | USD | 467,458,974 | -2.6 | ||
| 38 | Glass and glassware | USD | 402,699,026 | -25.9 | ||
| 39 | Bamboo and rattan products | USD | 358,070,068 | -25.1 | ||
| 40 | Tyre cord fabrics and other fabrics for technical uses | USD | 337,630,519 | -25.6 | ||
| 41 | Fertilizers | Ton | 800,372 | 335,779,588 | -19.7 | -48.0 |
| 42 | Ceramic products | USD | 289,512,262 | -23.0 | ||
| 43 | Tea | Ton | 48,263 | 81,539,430 | -15.7 | -20.3 |
| 44 | Ores and other minerals product | Ton | 1,460,140 | 81,427,098 | -29.1 | -28.0 |
| 45 | Coal | Ton | 209,946 | 78,739,145 | -69.8 | -65.5 |
| 46 | Other products | USD | 7,651,906,902 | -8.6 | ||
Vietnam Import
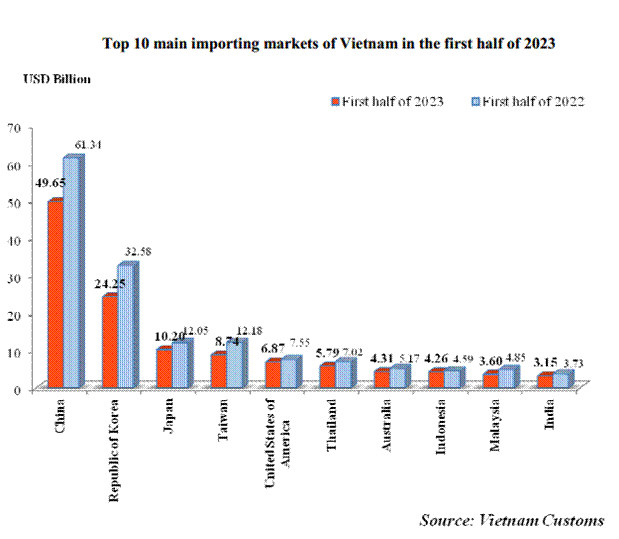
STATISTICS OF VIETNAM MAIN IMPORTS FIRST 6 MONTHS 2023
| No. | Main imports | Units | First 6 months 2023 | Compared with previous year (%) | ||
| Volume | Value (USD) | Volume | Value | |||
| TOTAL VALUE | USD | 151,837,331,539 | -18.4 | |||
| 1 | Computers, electrical products, spare-parts and components thereof | USD | 38,375,486,157 | -11.2 | ||
| 2 | Machine, equipment, tools and instruments | USD | 19,450,388,410 | -13.6 | ||
| 3 | Fabrics | USD | 6,415,958,030 | -19.4 | ||
| 4 | Iron and steel | Ton | 5,562,574 | 4,770,043,423 | -14.4 | -31.6 |
| 5 | Plastics | Ton | 3,129,539 | 4,660,035,557 | -15.2 | -31.2 |
| 6 | Petroleum products | Ton | 5,213,849 | 4,160,767,130 | 8.8 | -16.7 |
| 7 | Chemicals | USD | 3,813,796,223 | -25.1 | ||
| 8 | Other base metals | Ton | 840,767 | 3,707,277,417 | -17.3 | -26.3 |
| 9 | Coal | Ton | 24,195,275 | 3,685,578,847 | 46.0 | -13.8 |
| 10 | Chemical products | USD | 3,667,452,127 | -18.6 | ||
| 11 | Crude oil | Ton | 5,868,887 | 3,593,983,152 | 41.0 | 9.5 |
| 12 | Telephones, mobile phones and parts thereof | USD | 3,571,389,294 | -65.3 | ||
| 13 | Plastic products | USD | 3,521,030,647 | -15.9 | ||
| 14 | Textile, leather and foot-wear materials and auxiliaries | USD | 2,879,837,323 | -18.3 | ||
| 15 | Iron and steel products | USD | 2,428,721,343 | -4.1 | ||
| 16 | Animal fodders and animal fodder materials | USD | 2,337,228,873 | -12.0 | ||
| 17 | Parts and accessories of motor vehicles | USD | 2,007,758,223 | -28.0 | ||
| 18 | Cashew nut | Ton | 1,361,315 | 1,727,401,802 | 16.4 | 0.4 |
| 19 | Motor vehicles | Unit | 70,915 | 1,650,908,764 | 11.4 | 5.2 |
| 20 | Pharmaceutical products | USD | 1,609,795,248 | -6.0 | ||
| 21 | Cotton | Ton | 629,593 | 1,406,045,039 | -7.5 | -23.3 |
| 22 | Fishery products | USD | 1,270,833,961 | 2.5 | ||
| 23 | Maize (corn) | Ton | 3,713,819 | 1,235,661,017 | -18.4 | -23.1 |
| 24 | Insulated wires and cables | USD | 1,169,368,308 | -4.0 | ||
| 25 | Ores and other minerals product | Ton | 9,554,821 | 1,069,331,759 | -22.4 | -36.4 |
| 26 | Yarn | Ton | 509,192 | 1,064,891,178 | -7.7 | -24.4 |
| 27 | Wood and wooden products | USD | 1,039,903,146 | -34.2 | ||
| 28 | Electric consumer products and parts thereof | USD | 1,029,651,074 | -23.8 | ||
| 29 | Other base metal products | USD | 1,018,833,977 | 2.9 | ||
| 30 | Rubber | Ton | 728,962 | 988,496,822 | -35.2 | -41.1 |
| 31 | Still image, video cameras and parts thereof | USD | 980,629,159 | 0.6 | ||
| 32 | Paper | Ton | 1,046,042 | 971,145,718 | -10.2 | -16.7 |
| 33 | Ferrous waste and scrap | Ton | 2,343,556 | 935,828,010 | -7.5 | -27.0 |
| 34 | Wheats | Ton | 2,480,680 | 892,141,294 | 10.3 | 6.9 |
| 35 | Fruits and vegetables | USD | 888,079,416 | 0.6 | ||
| 36 | Liquefied petroleum gases (LPG) | Ton | 1,150,058 | 750,286,107 | 44.0 | 4.3 |
| 37 | Glass and glassware | USD | 743,713,983 | -3.1 | ||
| 38 | Other petroleum products | USD | 735,029,320 | -2.9 | ||
| 39 | Soya beans | Ton | 1,118,105 | 728,128,557 | 8.4 | 3.4 |
| 40 | Other edible food preparations | USD | 640,235,072 | -6.3 | ||
| 41 | Milk and milk products | USD | 612,124,824 | -13.2 | ||
| 42 | Other means of transportation, parts and accessories thereof | USD | 597,757,947 | -18.4 | ||
| 43 | Essential oils and resinoids; perfumery, cosmetic or toilet preparations | USD | 594,749,952 | 8.5 | ||
| 44 | Fertilizers | Ton | 1,702,044 | 589,160,218 | -4.5 | -30.6 |
| 45 | Animal, vegetable fats and oils | USD | 553,076,748 | -22.9 | ||
| 46 | Precious stones, precious metal and articles thereof | USD | 476,411,445 | -28.1 | ||
| 47 | Rubber products | USD | 441,984,257 | -17.0 | ||
| 48 | Paper products | USD | 409,829,839 | -16.1 | ||
| 49 | Insecticides, rodenticides and materials | USD | 406,249,570 | -19.4 | ||
| 50 | Motorcycles and parts, accessories thereof | Unit | 320,122,737 | -17.0 | ||
| 51 | Pharmaceutical materials | USD | 226,026,676 | 4.4 | ||
| 52 | Pastrycooks, sweets and cereal products | USD | 218,938,147 | -9.3 | ||
| 53 | Tobacco materials | USD | 63,819,596 | -60.7 | ||
| 54 | Other products | USD | 8,734,008,676 | -15.4 | ||
Vietnam Logistics industry
According to Vietnam Logistics Business Association, the increase rate of Vietnam Logistics in recent years are aroud 14 – 16% with value of 40 – 42 billion USD per year. There are around 5000 local companies and 25 biggest incorporation in the world join the market
The World Bank’s Report on Logistics Performance Index (LPI)
| Country | Year | LPI Rank | LPI Score | Customs Score | Infrastructure Score | International Shipments Score | Logistics competence Score | Tracking & tracing Score | Timelinese Score |
| Vietnam | 2023 | 43 | 3.3 | 3.1 | 3.2 | 3.3 | 3.2 | 3.4 | 3.3 |
| Vietnam | 2018 | 39 | 3.27 | 2.95 | 3.01 | 3.16 | 3.4 | 3.45 | 3.67 |
| Vietnam | 2016 | 64 | 2.98 | 2.75 | 2.7 | 3.12 | 2.88 | 2.84 | 3.5 |
| Vietnam | 2014 | 48 | 3.15 | 2.81 | 3.11 | 3.22 | 3.09 | 3.19 | 3.49 |
| Vietnam | 2012 | 53 | 3 | 2.65 | 2.68 | 3.14 | 2.68 | 3.16 | 3.64 |
| Vietnam | 2010 | 53 | 2.96 | 2.68 | 2.56 | 3.04 | 2.89 | 3.1 | 3.44 |
| Vietnam | 2007 | 53 | 2.89 | 2.89 | 2.5 | 3 | 2.8 | 2.9 | 3.22 |
The Logistics Performance Index (LPI) is an interactive benchmarking tool created by the World Bank to help countries identify the challenges and opportunities they face in their performance on trade logistics and what they can do to improve their performance. It is the weighted average of the country scores on six key dimensions:
Customs: efficiency of the clearance process (i.e., speed, simplicity and predictability of formalities) by border control agencies, including Customs
Infrastructure: quality of trade and transport related infrastructure (e.g., ports, railroads, roads, information technology)
International transport: ease of arranging competitively priced shipments; competence and quality of logistics services (e.g., transport operators, customs brokers)
Logistics capacity: Ability to track and trace consignments
Tracking and retrieval: Timeliness of shipments in reaching destination within the scheduled or expected delivery time
The Logistics Performance Index is reported by the World Bank regularly. The LPI is based on a worldwide survey of stakeholders on the ground providing feedback on the logistics “friendliness” of the countries in which they operate and those with which they trade. They combine in-depth knowledge of the countries in which they operate with informed qualitative assessments of other countries where they trade and have experience of global logistics environment.
Vietnam logistics legal infrastructure
Vietnam joint many international organizations, as the result Vietnam’s law and legal documents, including logistics ones also have been restructured to adapt to the international law.
Vietnam is building electronic Government, the customs field is one of the top administrative area that apply technology.
Viet Nam had launched her National Single Window since November 2014. Until 30 June 2022, there are 13 governmental agencies which have implemented 249 administrative procedures, linking nearly 4.95 million sets of records from over 55 thousand businesses.
Viet Nam has joint live operation of ASEAN Single Window since 1 Jan 2018. At the time of 2022, Vietnam officially can exchange C/O form D with all 9 ASEAN countries
According to the Vietnam Customs Department, in 2022:
- The average customs clearance time for imported goods was 36 hours, 14 minutes, and 32 seconds
- For exported goods, the average customs clearance time in 2022 was 2 hours, 43 minutes, and 9 seconds
HS Convention came into effect in Vietnam in 2000, the HS code in Vietnam has 8 digit, fully base on the ASEAN Harmonized Tariff Nomenclature (AHTN), in which the first 6 digit from HS Convention and the 7th and the 8th is for ASEAN purpose
Vietnam logistics infrastructure
Sea transport infrastructure
As of June 2022, the Vietnamese seaport system consists of 286 port terminals categorized into 5 groups of seaports. The total length of port quays exceeds 96 km, with sufficient infrastructure to accommodate over 706 million tons of cargo throughput in 2021. The establishment of international transshipment gateways has been successful in both the northern and southern regions. Notably, the Lạch Huyện port area in Hải Phòng has handled container ships up to 132,000 DWT, and the Cái Mép port area in Bà Rịa – Vũng Tàu has accommodated vessels up to 214,000 DWT, showcasing the growing capacity to handle larger vessels.
Statistics | Unit | Group 1 | Group 2 | Group 3 | Group 4 | Group 5 | Total |
| Number of port terminals | Port terminals | 68 | 45 | 29 | 107 | 37 | 286 |
| Number of port quays | Port Quays | 127 | 113 | 61 | 218 | 69 | 588 |
| Number of container cranes | Port Quays | 72 | 57 | 30 | 91 | 37 | 287 |
| Specialized handling | Berth handling | 55 | 56 | 31 | 127 | 32 | 301 |
| Length | M | 19.693 | 21.130 | 10.453 | 37.357 | 7.642 | 96.275 |
| Cargo Throughput in 2021 | Tr.T/ year | 199,05 | 97,34 | 90,53 | 298,35 | 20,83 | 706,13 |
Most of the seaports in Vietnam are closely connected to major economic centers and regions, serving as pivotal points for import and export of goods and driving regional development. Notable examples include:
- Quảng Ninh and Hải Phòng, linked to the key economic region in the North
- Nghi Sơn, Hà Tĩnh, Thừa Thiên – Huế, Đà Nẵng, Quảng Ngãi, and Quy Nhơn, associated with the central economic region
- Khánh Hòa and Bà Rịa – Vũng Tàu, along with Ho Chi Minh City and Đồng Nai, situated near the dynamic economic region in the Southeast
- Cần Thơ, Long An, and An Giang, tied to the Mekong Delta’s key economic region.
In terms of scale and quality, Vietnam’s seaport system has been emphasized and invested in to meet international standards, particularly in the realm of container ports. Both of Vietnam’s major container ports, Hải Phòng and Ho Chi Minh City, are ranked among the world’s top 50 container ports, showcasing the focus on current technology and international standards in recent years. In which The two international gateway port: Cai Mep – Thi Vai in the South can receive mother vessel of 160,000 – 194,000 DWT and Lach Huyen gateway port in the Hai Phong (the North) can receive mother vessel of 150,000 DWT.
In 2021, the total cargo throughput handled by Vietnam’s seaports reached 706.13 million tons, showing a 2% growth compared to 2020 despite the impact of the COVID-19 pandemic. This consisted of 185.1 million tons of exports, marking a 4.4% increase, and 305.8 million tons of domestic cargo, experiencing a 6.3% growth. Notably, container cargo reached nearly 24 million TEUs, indicating a 7% rise compared to the previous year. The total transportation output carried by Vietnam’s maritime fleet also showed resilience during the pandemic, reaching 156.5 million tons, a 2% increase compared to 2020. Particularly noteworthy is the 54% growth (5 million tons) in the volume of international import-export cargo carried by Vietnam’s advancing fleet in comparison to 2020. The major goods transported on international routes include China, Japan, South Korea, Southeast Asia, and certain European destinations.
The cargo volume through seaports during the first 9 months of 2022 reached 550.2 million tons, reflecting a 35% increase compared to the same period in 2021. This included 134.3 million tons of exports and 257.5 million tons of domestic cargo. Container cargo reached 18.9 million TEUs, a 2.3% rise compared to the same period in 2021.
In terms of maritime routes, Vietnam has established 32 routes, comprising 25 international routes and 7 domestic routes. Beyond the regional Asian routes, the northern region has launched 2 routes to North America, and the southern region has developed 16 routes to North America and Europe, surpassing other Southeast Asian countries (after only to Malaysia and Singapore).
Currently, there are 45 active seaports nationwide, including: 2 seaports of type IA (international gateway port); 12 grade I seaports (regional hub general port); 18 ports of type II (local general ports) and 13 ports of type III (offshore oil ports). The total number of ports is 265 ports / 402 wharves with 87,550 m long wharf, total designed capacity of about 500-550 million tons of cargo / year (TDSI, 2018).
Air transport infrastructure
As of June 2022, there are 22 operational airports across the country, covering a total area of approximately 11,859 hectares. Among these, there are 9 international airports and 13 domestic airports [1], divided into three regions: North, Central, and South.
- In the North region, there are 7 airports: Nội Bài, Văn Đồn, Cát Bi, Thọ Xuân, Vinh, Điện Biên, and Đồng Hới.
- In the Central region, there are 7 airports: Đà Nẵng, Cam Ranh, Phú Bài, Phù Cát, Tuy Hòa, Pleiku, and Chu Lai.
- In the South region, there are 8 airports: Tân Sơn Nhất, Cần Thơ, Phú Quốc, Buôn Ma Thuột, Liên Khương, Rạch Giá, Côn Đảo, and Cà Mau.
During the period from 2012 to 2019, there was a significant growth surge in the aviation transport market due to the development of airport infrastructure, the expansion of aircraft fleets, and the increase in flight routes. However, the years 2020-2021 were marked by substantial losses in the aviation industry, as the global economy, including the aviation sector, was severely impacted by the COVID-19 pandemic. In the first six months of 2021, passenger transportation volume decreased by 19.4% compared to the same period in 2020 (international traffic decreased by 97.9%, while domestic traffic increased by 1.4%). As a result, investment in airport infrastructure in 2021 experienced a slowdown due to the COVID-19 pandemic, compounded by limitations in investment capital.
Over the course of more than 30 years of development, the air cargo transport market has experienced a significant leap in growth. In 2021, the cargo output reached 1.3 million tons, and it is projected to exceed 1.52 million tons in 2022. This represents an impressive increase of nearly 83 times compared to 1991 and a growth of 21.2% compared to 2019. The average annual growth rate over the period from 1991 to 2022 stands at 15.3%.
Currently, there are five Vietnamese airlines engaged in cargo transport, namely Vietnam Airlines (including VASCO), Vietjet Air, Pacific Airlines, Bamboo Airways, and Vietravel Airlines. These airlines operate cargo transportation alongside passenger flights, yet there isn’t a dedicated cargo airline using specialized freighter aircraft.
On the international front, the Vietnamese air cargo market is served by 29 foreign airlines from 16 countries and territories, operating cargo flights to Vietnam. However, at present, there is no domestic airline specializing in cargo transport using dedicated freighter aircraft.
According to the draft Master Plan for the Comprehensive Development of the National Airport System for the period 2021- 2030, with a vision to 2050 (currently under government approval process), the plan envisions a total of 28 airports by 2030, comprising 14 international airports and 14 domestic airports. The direction for 2050 involves planning for 29 airports, including 14 international airports and 15 domestic airports. In line with the draft plan, a priority is placed on establishing logistics centers as focal points for cargo consolidation at airports with transportation needs exceeding 250,000 tons per year. These logistics centers ensure suitable warehousing conditions and connections to various modes of transportation for effective cargo transport. The planned logistics centers at airports include Nội Bài, Tân Sơn Nhất, Long Thành, Chu Lai, Vân Đồn, Cần Thơ, and several other airports as needed to meet the criteria. The aim is to develop significant cargo logistics centers and international transshipment hubs at the Chu Lai International Airport.
For the international cargo transportations, mainly cargo is imported/exported via 3 international airports as below:
| Airport code | City | Airport name | Note |
| VNHAN | Ha Noi | Noi Bai International Airport | in the North of Vietnam |
| VNSGN | Ho Chi Minh City | Tan Son Nhat International airport | in the South of Vietnam |
| VNDAD | Da Nang | Danang International Airport | in the Central of Vietnam |
Road transport infrastructure
Currently, nationwide, the total length of road infrastructure is 595,201 km, of which the national road system (including national highways and expressways) accounts for 25,560 km. The national road network’s structural system is planned according to the Vietnam Road Network Plan for the period 2021 – 2030, with a vision towards 2050, as stipulated in Decision No. 1454/QD-TTg dated September 1st, 2022. This road network plan ensures smooth connectivity between economic centers, seaports, border crossings, and the national highway system is allocated along vertical axes, horizontal axes, and radial axes, forming transportation corridors..
As of June 2022, the high-speed road network has put approximately 23 segments into operation, equivalent to 1,239 km; and is currently under construction for about 14 segments, equivalent to 840 km.
The high-speed road network, in general, remains insufficient, especially along major transportation routes with high traffic volume, such as the North-South corridor and the ring roads of Hanoi and Ho Chi Minh City. Overall, the coverage of the national highway network is quite good; however, due to geographical conditions, up to 39% of the national highway network is located in hilly and mountainous areas. Many planned segments are designated as national highways but haven’t been upgraded yet, with low design standards not meeting the required planning criteria.
The national highway system has approximately 64.76% of its road surface covered with asphalt, while the remaining portions consist of concrete, asphalt overlays, and lower-grade surfaces. The road distribution by lane configuration is as follows: single-lane roads account for 11.04%, two-lane roads make up about 74.53%, four-lane roads represent 13.93%, and roads with six to ten lanes account for 0.5%. The rest consists of alternating lanes with varying widths.
Up until June 2022, among the 10 crucial and urgent road projects (with a total investment of 8,000 billion VND), several have been invested in, upgraded, completed, and put into operation, contributing to enhancing the transportation capacity. These projects include the upgrade of the road network in Ninh Binh to increase capacity, the upgrade of National Road 14 connecting Ha Giang and Lao Cai, improvements and upgrades on various sections such as the Pò Mã Border Gate – Bắc Kan Quản Lộ route, the bypass segment of National Road 27 in Liên Khương, the upgrade of National Road 30 from Cao Lãnh to Hồng Ngự, and the upgrade of National Road 53 from Trà Vinh to Long Toàn.
Regarding the ring roads, Hanoi places priority on the Belt Road 4 project, while Ho Chi Minh City prioritizes Belt Road 3 to enhance connectivity with neighboring areas, facilitate the transport of goods, and reduce logistics costs to the seaports. Particularly for the Mekong Delta region, goods currently transported to Ho Chi Minh City’s seaports for export increase transport and logistics expenses.
Railway infrastructure
The national railway network has a total length of 3,143 km and encompasses 277 stations. This network comprises 2,703 km of mainline tracks and 612 km of branch lines, encompassing 7 main routes. The railway network interconnects at the hub of Hanoi, passing through 34 provinces and cities, covering 4 out of 6 economic regions in the country. The railway density is around 9.5 km per 1,000 km of area, which is an average level within the ASEAN bloc and globally. Currently, there are 2 connections with China at Đồng Đăng (Hanoi – Đồng Đăng cross-border line) and at Lào Cai (Hanoi – Lào Cai line).
The operational capacity on most main railway lines is limited, with only 17-25 train pairs per day for passenger and freight trains, with average speeds of 50-70 km/h (up to 100 km/h for passenger trains and 60 km/h for freight trains). Since most of the railway lines were built a long time ago, they have low technical standards, numerous weight restrictions, and narrow profiles, resulting in lower train speeds and reduced competitiveness compared to other transportation modes.
As of June 2022, 4 crucial and urgent railway projects have been initiated. The current railway network has connected 4 out of 6 regions, 34 provinces and cities, utilizing 3 lines along the two major corridors of Hanoi – Ho Chi Minh City and Lào Cai – Hanoi – Hải Phòng, which constitute 78% of the network. These lines handle 98% of passenger traffic and 88% of freight transportation via rail. Vietnam Railways has also enhanced connections to 2 seaports (Cái Lân, Hải Phòng), 2 inland waterway ports (Việt Trì, Ninh Bình), and 1 dry port (Lào Cai). However, there is still a great need for continued investment to improve connectivity, operational efficiency, and reduce logistics costs.
Inland Waterway Infrastructure
The total length of inland waterways managed and operated nationwide is 17,026 km, of which 7,180 km are national inland waterways managed by the Inland Waterways Administration (3,044.4 km in the North, 2,968.9 km in the South, and 1,167.5 km in the Central region). The network comprises 45 primary waterway transport routes, with 17 in the North, 10 in the Central region, and 18 in the South. Additionally, there are 21 secondary routes for riverine transport, with 6 in the North, 4 in the Central region, 11 in the South, and some routes shared with maritime lanes.
Nationally, there are 292 inland ports, including 217 cargo ports, 12 passenger ports, 2 comprehensive ports, and 63 specialized ports. Moreover, there are around 8,200 inland berths and over 2,500 cross-river ferries.
Regarding scale and quality, the inland waterway system is primarily utilized for cargo loading and unloading, as well as specialized cargo handling, often with outdated equipment and lower productivity. Comprehensive and container-specific inland ports have seen modern investments; however, the operational efficiency is divided (lower prioritization for lower-tier cargo compared to design capacity). The current limitation of the inland port system is the road connectivity to ports, which have limited load capacity and are not favorable for transshipment by trucks. This issue arises because ports and terminals are often privately invested, whereas roads receive less attention from the government. There’s a need for mechanisms and preferential policies for public investment in inland ports connected with dry ports (ICDs), and prioritizing funding and specific investment forms to create seamless connections between waterway ports and road networks.
In the Vietnam Seaport Master Plan, the connection between inland waterways and seaport systems is highly emphasized. The plan focuses on the development of container transport routes and inland container terminals, connecting the coastal ports of Quảng Ninh and Hải Phòng with inland waterway terminals in Nam Định and Ninh Bình. It also proposes container transport routes connecting the Cái Mép – Thị Vải port complex along the coast to waterway terminals in Cà Mau and Kiên Giang, extending from Cái Mép – Thị Vải – Ho Chi Minh City to Cambodia through the Tiền River route and connecting to the Hậu River route to Cần Thơ, further developing to An Giang. Additionally, routes are suggested to connect Cái Mép – Thị Vải to Đồng Nai, Bình Dương, and Tây Ninh.
Logistics HP Global Vietnam
Freight forwarder, Customs Broker and Vietnam Import/export license
Building No. 13, Lane 03, N003, Van Khe, Ha Dong, Hanoi
Website: hpgloballtd.com
Email: info@hpgloballtd.com
Phone: Hotline: ++84 984870199/ ++84 8 8611 5726
Note:
– The article is for reference only, prior to using the content, it is suggested that you should contact HP Global for whether any update
– HP Global keep it full right copy right of the article. No copy for commercial purpose is approved.
– Any copy without approval by HP Global (even note quote from website hpgloballtd.com/hptoancau.com) can cause to our claim to google and related agencies.
")