CARGO TRANSPORTATION LANE VIETNAM AND THAILAND
Vietnam and Thailand are important trading partners. In this article, HP Global overview some key points related to transportation of cargo import from Thailand to Vietnam and export from Vietnam to Thailand.

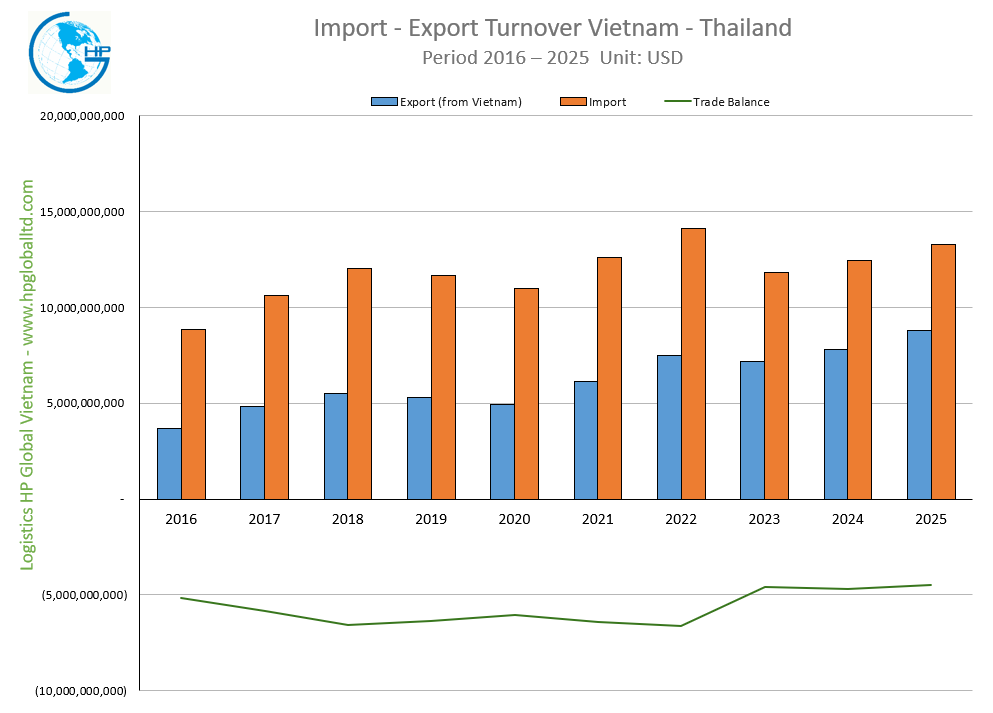
Trade Turnover Vietnam – Thailand Annually
Import – Export Turnover Vietnam – Thailand
Period 2016 – 2025
Unit: Million USD
| 2016 | 2017 | 2018 | 2019 | 2020 | 2021 | 2022 | 2023 | 2024 | 2025 | |
| Export (from Vietnam) | 3.690,73 | 4.808,37 | 5.487,43 | 5.303,08 | 4.916,94 | 6.155,17 | 7.476,21 | 7.192,47 | 7.782,82 | 8.796,88 |
| Import | 8.849,42 | 10.642,52 | 12.042,82 | 11.663,19 | 10.964,78 | 12.585,80 | 14.092,41 | 11.797,47 | 12.447,50 | 13.281,92 |
| Total trade | 12.540,15 | 15.450,88 | 17.530,25 | 16.966,28 | 15.881,72 | 18.740,98 | 21.568,62 | 18.989,94 | 20.230,32 | 22.078,80 |
| Trade Balance | (5.158,69) | (5.834,15) | (6.555,39) | (6.360,11) | (6.047,84) | (6.430,63) | (6.616,21) | (4.605,01) | (4.664,68) | (4.485,04) |

Source: Re-arrange from Statistics of Vietnam Customs Department
Export Turnover from Vietnam to Thailand per Commodities
Which commodities that Vietnam export to Thailand?
Export value from Vietnam to Thailand:
|
Commodity
|
Units
|
2024 | 2025 |
Compare turnover (%)
|
||
| Volume | Value (USD) | Volume | Value (USD) | |||
| Thailand | 7.782.818.710 | 8.796.883.187 | 113,03% | |||
| Fishery products | USD | 258.591.641 | 301.918.544 | 116,75% | ||
| Fruits and vegetables | USD | 278.169.481 | 115.728.888 | 41,60% | ||
| Cashew nut | Ton | 9.861 | 56.283.287 | 11.977 | 78.047.445 | 138,67% |
| Coffee | Ton | 38.833 | 170.335.665 | 42.023 | 352.081.247 | 206,70% |
| Pepper | Ton | 5.712 | 36.206.587 | 8.234 | 62.721.508 | 173,23% |
| Pastrycooks, sweets and cereals products | USD | 33.344.642 | 33.468.344 | 100,37% | ||
| Animal fodders and animal fodder materials | USD | 27.514.236 | 48.989.784 | 178,05% | ||
| Ores and other minerals product | Ton | 1.883 | 1.310.908 | 2.539 | 592.708 | 45,21% |
| Coal | Ton | 25.180 | 5.203.030 | 35.052 | 5.773.403 | 110,96% |
| Crude oil | Ton | 1.032.205 | 688.190.093 | 800.993 | 448.438.756 | 65,16% |
| Petroleum products | Ton | 8.132 | 7.433.895 | 2.314 | 1.652.106 | 22,22% |
| Chemicals | USD | 68.253.008 | 143.899.752 | 210,83% | ||
| Chemical products | USD | 377.376.297 | 137.645.522 | 36,47% | ||
| Fertilizers | Ton | 20.255 | 9.810.463 | 16.495 | 8.015.673 | 81,71% |
| Plastics | Ton | 93.187 | 112.086.034 | 56.462 | 73.008.728 | 65,14% |
| Plastic products | USD | 216.167.295 | 140.610.349 | 65,05% | ||
| Rubber products | USD | 22.554.041 | 22.121.168 | 98,08% | ||
| Handbags, purses, suit-cases, headgear and umbrellas | USD | 12.944.841 | 12.712.147 | 98,20% | ||
| Wood and wooden products | USD | 75.473.453 | 84.788.096 | 112,34% | ||
| Paper and paper products | USD | 134.240.278 | 148.517.009 | 110,64% | ||
| Yarn | Ton | 28.470 | 76.484.780 | 28.035 | 75.371.632 | 98,54% |
| Textiles and garments | USD | 288.972.175 | 281.783.070 | 97,51% | ||
| Tyre cord fabrics and other fabrics for technical uses | USD | 41.437.785 | 42.008.590 | 101,38% | ||
| Foot-wears | USD | 109.236.210 | 117.251.753 | 107,34% | ||
| Textile, leather and foot-wear materials and auxiliaries | USD | 46.653.907 | 61.581.545 | 132,00% | ||
| Ceramic products | USD | 34.552.919 | 38.685.730 | 111,96% | ||
| Glass and glassware | USD | 45.177.366 | 10.667.272 | 23,61% | ||
| Precious stones, precious metal and articles thereof | USD | 13.662.563 | 24.718.983 | 180,92% | ||
| Iron and steel | Ton | 163.309 | 148.585.368 | 285.745 | 220.487.831 | 148,39% |
| Iron and steel products | USD | 129.258.046 | 156.475.062 | 121,06% | ||
| Other base metals and other base metal products | USD | 166.364.022 | 178.869.319 | 107,52% | ||
| Computers, electrical products, spare-parts and components thereof | USD | 886.302.378 | 1.793.245.518 | 202,33% | ||
| Telephones, mobile phones and parts thereof | USD | 785.443.470 | 806.772.778 | 102,72% | ||
| Machine, equipment, tools and instruments | USD | 1.047.351.104 | 1.193.122.530 | 113,92% | ||
| Insulated wires and cables | USD | 77.086.084 | 89.422.231 | 116,00% | ||
| Other means of transportation, parts and accessories thereof | USD | 580.347.308 | 682.970.931 | 117,68% | ||
| Other products | USD | 714.414.049 | 802.717.234 | 112,36% | ||
Source: Statistics from Vietnam Customs Department
Import Turnover from Thailand to Vietnam per Commodities
Which commodities that Vietnam import from Thailand?
Import value from Thailand to Vietnam:
|
Commodity
|
Units
|
2024 | 2025 |
Compare turnover (%)
|
||
| Volume | Value (USD) | Volume | Value (USD) | |||
| Thailand | 12.447.496.964 | 13.281.919.962 | 106,70% | |||
| Fishery products | USD | 22.051.137 | 22.425.946 | 101,70% | ||
| Milk and milk products | USD | 56.101.553 | 65.271.560 | 116,35% | ||
| Fruits and vegetables | USD | 62.136.797 | 74.734.289 | 120,27% | ||
| Maize (corn) | Ton | 3.905 | 14.698.390 | 3.936 | 15.988.484 | 108,78% |
| Animal, vegetable fats and oils | USD | 80.024.512 | 89.256.795 | 111,54% | ||
| Pastrycooks, sweets and cereal products | USD | 69.912.863 | 77.616.105 | 111,02% | ||
| Other edible food preparations | USD | 82.945.843 | 89.732.031 | 108,18% | ||
| Animal fodders and animal fodder materials | USD | 128.314.213 | 126.783.172 | 98,81% | ||
| Ores and other minerals product | Ton | 1.072.962 | 90.969.284 | 1.124.106 | 101.816.957 | 111,92% |
| Petroleum products | Ton | 853.674 | 643.369.931 | 435.442 | 310.769.885 | 48,30% |
| Liquefied petroleum gases (LPG) | Ton | 31.177 | 22.276.100 | 1.737 | 1.271.745 | 5,71% |
| Other petroleum products | USD | 107.277.166 | 80.617.264 | 75,15% | ||
| Chemicals | USD | 379.305.015 | 388.326.315 | 102,38% | ||
| Chemical products | USD | 381.683.832 | 392.646.666 | 102,87% | ||
| Pharmaceutical materials | USD | 2.024.396 | 1.636.370 | 80,83% | ||
| Pharmaceutical products | USD | 106.338.264 | 76.031.057 | 71,50% | ||
| Fertilizers | Ton | 18.267 | 6.430.228 | 6.000 | 4.035.573 | 62,76% |
| Essential oils and resinoids; perfumery, cosmetic or toilet preparations | USD | 152.196.991 | 173.463.897 | 113,97% | ||
| Insecticides, rodenticides and materials | USD | 40.354.642 | 46.769.877 | 115,90% | ||
| Plastics | Ton | 541.162 | 712.424.101 | 577.315 | 693.338.246 | 97,32% |
| Plastic products | USD | 258.153.224 | 265.244.762 | 102,75% | ||
| Rubber | Ton | 89.147 | 168.860.635 | 112.649 | 216.226.145 | 128,05% |
| Rubber products | USD | 98.089.264 | 98.102.422 | 100,01% | ||
| Wood and wooden products | USD | 147.547.408 | 149.207.603 | 101,13% | ||
| Paper | Ton | 161.431 | 149.091.851 | 176.043 | 151.145.893 | 101,38% |
| Paper products | USD | 84.486.788 | 69.020.515 | 81,69% | ||
| Yarn | Ton | 97.794 | 135.267.309 | 84.678 | 112.902.282 | 83,47% |
| Fabrics | USD | 267.264.739 | 233.904.020 | 87,52% | ||
| Textile, leather and foot-wear materials and auxiliaries | USD | 325.019.346 | 309.834.363 | 95,33% | ||
| Glass and glassware | USD | 52.486.706 | 56.013.910 | 106,72% | ||
| Precious stones, precious metal and articles thereof | USD | 46.634.123 | 41.790.953 | 89,61% | ||
| Iron and steel | Ton | 51.282 | 66.693.824 | 49.179 | 56.524.136 | 84,75% |
| Iron and steel products | USD | 144.257.197 | 156.606.977 | 108,56% | ||
| Other base metals | Ton | 107.326 | 691.665.105 | 135.272 | 849.850.994 | 122,87% |
| Other base metal products | USD | 60.685.091 | 62.340.331 | 102,73% | ||
| Computers, electrical products, spare-parts and components thereof | USD | 1.319.476.258 | 1.923.635.315 | 145,79% | ||
| Electric consumer products and parts thereof | USD | 799.592.203 | 820.799.186 | 102,65% | ||
| Still image, video cameras and parts thereof | USD | 47.455.581 | 108.048.249 | 227,68% | ||
| Machine, equipment, tools and instruments | USD | 1.014.430.431 | 1.095.291.609 | 107,97% | ||
| Insulated wires and cables | USD | 82.739.070 | 121.563.727 | 146,92% | ||
| Motor vehicles | Unit | 63.769 | 1.241.422.184 | 66.109 | 1.323.647.782 | 106,62% |
| Parts and accessories of motor vehicles | USD | 691.256.533 | 776.879.928 | 112,39% | ||
| Other products | USD | 1.394.086.838 | 1.450.806.628 | 104,07% | ||
Source: Statistics from Vietnam Customs Department
Shipping Time Vietnam Thailand
Name of ports/airport and shipping times between Vietnam – Thailand
-> See the Article: Cargo Shipping Vietnam – Thailand
Trade relations between Vietnam and Thailand
HP Global Logistics offers tax consultation services, import procedures, and customs services for the import and export of goods in Vietnam Thailand. For inquiries, please contact our hotline at +84 886 115 726 or +84 984 870 199.
Currently, there are FTAs of ATIGA, ACFTA, AHKFTA, AKFTA , AJCEP, AIFTA , AANZFTA, RCEP between Vietnam and Thailand.
>> To check the updated legal documents related to special preferential import duty under the above FTA, see the below article: List of FTA Vietnam Joined
→ To check the updated trade relations (MFN, FTAs) between Vietnam and Thailand at the article: Overview Of Trade Relations Between Vietnam And The World
Check import/export duty to/from Vietnam?
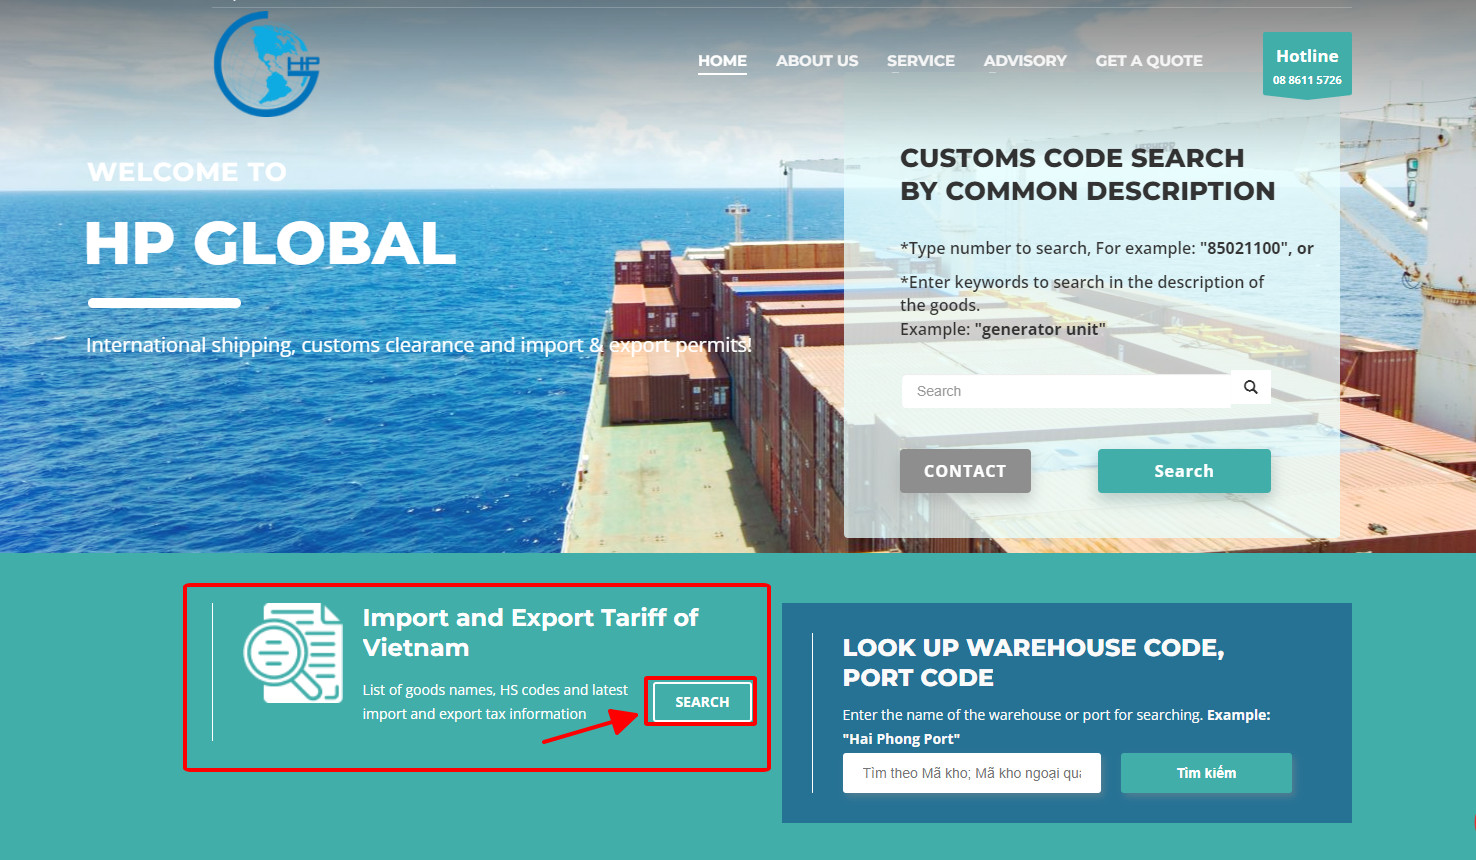
To check the update import duty / export duty for cargo import to / export from Vietnam to Thailand, you can contact HP Global via email info@hpgloballtd.com or hotline ++84 886115726 / ++84 984870199 or search on website hptoancau.com as instructed in the image below
Select HP Global as the freight forwarder for your shipments Vietnam – Thailand
HP Global is a freight forwarder with a top reputation in Vietnam.
→ Contact us for freight and inbound and outbound services for shipments to/from Vietnam – Email: info@hpgloballtd.com
Logistics HP Global Vietnam
Freight forwarder, Customs Broker and Vietnam Import/export license
Building No. 13, Lane 03, N003, Van Khe, Ha Dong, Hanoi
Website: hpgloballtd.com / hptoancau.com
Email: info@hpgloballtd.com
Phone: ++84 24 73008608 / Hotline: ++84 984870199/ ++84 8 8611 5726/ Whatsapp: ++84 865996476
Note:
– The article is for reference only, prior to using the content, it is suggested that you should contact HP Global for whether any update
– HP Global keep it full right copy right of the article. No copy for commercial purpose is approved.
– Any copy without approval by HP Global (even note quote from website hpgloballtd.com/hptoancau.com) can cause to our claim to google and related agencies.
 Tiếng Việt
  English
  简体中文
简体中文 


