I. Import turnover of goods from Vietnam – Hong Kong 2019
Over the years, Hong Kong and Vietnam have built strong bilateral trade relationships, especially in the areas of products and services. Vietnam is currently the 10th largest trading partner of Hong Kong. Only in the first 5 months of 2019, bilateral trade reached 7.06 billion USD. In which Hong Kong exported to Vietnam 4.06 billion USD, imported from Vietnam 3 billion USD. Vietnam is Hong Kong’s 14th largest import market. Besides, Hong Kong also leads in investing in Vietnam in the first 6 months of 2019 with a total investment of 5.3 billion USD.
According to the preliminary data of the General Department of Vietnam Customs, the total import turnover of Vietnam’s goods from Hong Kong in the first 9 months of 2019 reached US $ 1.04 billion, down 12.58% over the same period in 2018.

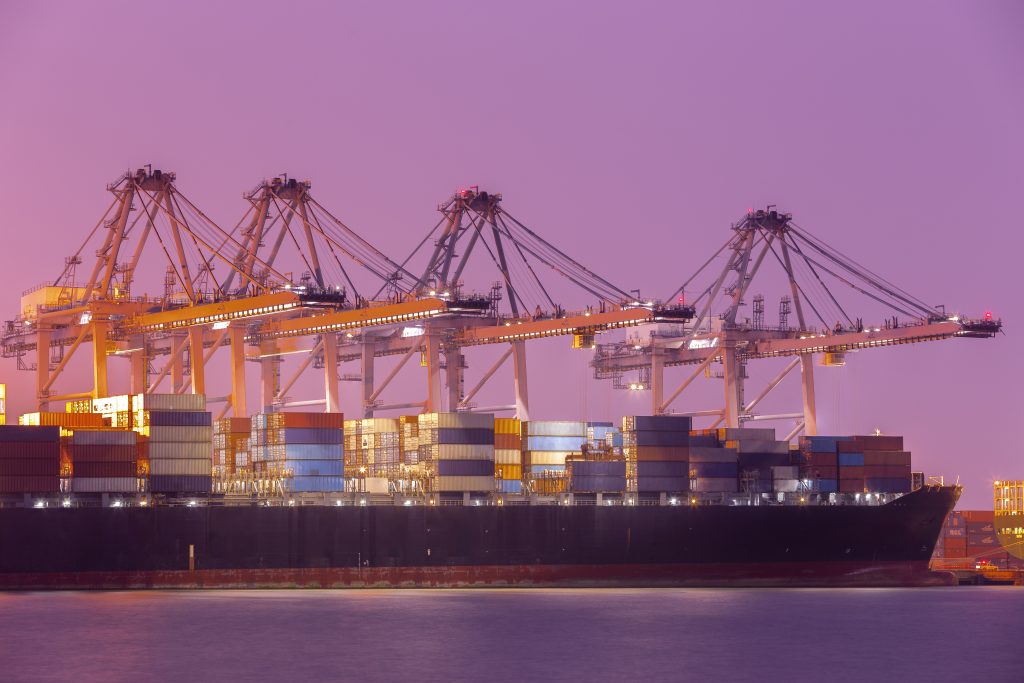
Industrial Container Cargo freight ship at habor for Logistic Import Export
Goods imported from Hong Kong market in 9 months / 2019
(* Calculation of figures from GDC)
| Items | May 9, 2019 | +/- compared to the same period of 2018 (%) * | ||
| Amount (ton) | Amount (ton) | Amount | Value | |
| Total | 1.048.770.334 | -12,58 | ||
| Gasoline of all kinds | 563 | 260.902 | 451,96 | 325,66 |
| Other products from petroleum | 2.139.208 | 204,33 | ||
| Chemistry | 4.609.423 | 47,42 | ||
| Chemical products | 19.631.495 | 120,12 | ||
| Plastic materials | 5.139 | 9.591.244 | 4,81 | -2,54 |
| Products from plastic | 29.461.874 | -4,32 | ||
| Products from rubber | 5.243.237 | -37,79 | ||
| Paper products | 28.045.214 | -12,93 | ||
| Fibers and yarns of all kinds | 352 | 1.683.758 | 5,71 | -30,69 |
| Fabrics of all kinds | 128.977.373 | -25,58 | ||
| Textile, garment, leather and footwear materials | 150.628.071 | -10,52 | ||
| Precious stones, precious metals and products | 51.777.764 | 9,39 | ||
| Iron and steel scrap | 271.515 | 88.779.022 | -36,01 | -43,02 |
| steels | 1.754 | 2.011.106 | -12,65 | -8,73 |
| Products from iron and steel | 4.798.597 | -14,42 | ||
| Other common metals | 3.178 | 13.670.979 | 6,43 | 21,05 |
| Computers, electronic products and components | 116.691.450 | -53,21 | ||
| Phones of all kinds and components | 65.490.092 | -1,59 | ||
| Machinery, equipment, tools and other spare parts | 254.288.844 | 105,33 | ||
| Wires and cables | 3.103.623 | 128,47 | ||
| Other goods | 67.887.059 | -30,86 | ||
II. Export turnover of goods from Vietnam – Hong Kong in 2018-2019
Data on Export of Vietnam’s goods to hongkong december and 12 May 2018
Unit: turnover (thousand USD), growth (%)
Source: Vietnam General Department of Customs
| Items | Turnover of December 2018 | Growth compared to December 2017 (%) | Turnover of 12M / 2018 | Growth compared to 12M / 2017 (%) |
| Computers, electronic products and components | 181.428,87 | 9,82 | 2.256.243,60 | 21,99 |
| Phones of all kinds and components | 69.458,45 | -44,22 | 1.782.959,96 | -18,33 |
| Cameras, camcorders and components | 105.568,14 | -11,65 | 1.296.556,58 | 25,40 |
| Machinery, equipment and other spare tools | 88.640,81 | -7,13 | 1.022.645,99 | -1,60 |
| Textiles | 28.811,98 | 33,56 | 282.007,33 | 30,29 |
| Textile, garment, leather and footwear materials | 13.124,26 | 53,33 | 212.059,18 | 17,62 |
| Seafood | 16.144,32 | 6,52 | 188.207,85 | 19,16 |
| Footwear | 20.362,12 | 22,05 | 186.672,69 | 5,82 |
| Fibers and yarns of all kinds | 6.829,63 | -1,09 | 84.281,81 | -12,32 |
| Bags, wallets, suitcases, umbrellas, umbrellas | 9.344,92 | 18,53 | 80.594,39 | 13,2 |
| Products from plastic | 6.070,16 | 27,7 | 62.196,09 | 105,28 |
| Rice | 5.330,58 | 21,32 | 50.609,19 | 63,65 |
| Wires and cables | 3.199,42 | -36,17 | 49.085,28 | -2,63 |
| Precious stones, precious metals and products | 1.558,67 | -54,33 | 30.822,32 | -17,43 |
| Cashew | 3.703,15 | -10,37 | 24.161,94 | 16,44 |
| Toys, sports equipment and parts | 2.479,17 | 40,63 | 22.691,78 | 33,88 |
| Vegetable goods | 1.788,83 | -2,63 | 21.489,11 | 3,27 |
| Products from iron and steel | 1.320,92 | 103,53 | 18.490,86 | 59,43 |
| Chemical products | 1.114,86 | 52,63 | 10.972,18 | -0,71 |
| Other common metals and products | 709,16 | -58,46 | 10.940,09 | -55,41 |
| Paper and paper products | 1.004,99 | 39,59 | 8.281,65 | 14,78 |
| Wood and wood products | 464,15 | -19,24 | 7.711,31 | -55,14 |
| Confectionery and cereal products | 479,63 | -16,85 | 6.746,10 | -10,5 |
| Rubber | 103,10 | -68,55 | 2.976,47 | -15,15 |
| Products from rubber | 187,89 | -46,18 | 2.706,94 | -27,95 |
| Plastic materials | 97,77 | -88,08 | 2.696,10 | -21,74 |
| Furniture made of materials other than wood | 280,03 | 7,54 | 2.248,45 | 49,52 |
| Ceramic products | 138,14 | 50,57 | 1.561,38 | 7,27 |
| steels | 82,09 | 34,66 | 790,68 | 30,84 |
– According to the statistics of the General Department of Vietnam Customs, the total export turnover of Vietnam’s goods to Hong Kong (China) in 2019 reached US $ 7.15 billion.
Goods exported to Hong Kong (China) market in 2019
(Calculated from figures published on January 13, 2020 of GDC)
Unit: USD, Source: Ministry of Industry and Trade of Vietnam
| Items | December 2019 | Compared to November 2019 (%) | 2019 | Compared to 2018 (%) | Proportion (%) |
| Total export turnover | 671.763.898 | 4,04 | 7.155.709.571 | -10,05 | 100 |
| Computers, electronic products and components | 323.387.607 | 7,65 | 3.034.230.374 | 34,48 | 42,4 |
| Phones of all kinds and components | 115.635.719 | 5,39 | 1.199.748.137 | -32,71 | 16,77 |
| Machinery, equipment and other spare tools | 58.297.439 | -8,84 | 744.167.307 | -27,23 | 10,4 |
| Cameras, camcorders and components | 25.047.923 | -2,58 | 466.408.672 | -64,03 | 6,52 |
| Textiles | 27.109.365 | 10,27 | 289.490.326 | 2,65 | 4,05 |
| Textile, garment, leather and footwear materials | 16.050.126 | 16,53 | 195.411.551 | -7,85 | 2,73 |
| Footwear | 17.110.711 | -21,58 | 195.114.477 | 4,52 | 2,73 |
| Seafood | 13.272.475 | 9,59 | 161.268.087 | -14,31 | 2,25 |
| Products from plastic | 5.982.279 | -9,29 | 101.536.739 | 63,25 | 1,42 |
| Bags, wallets, suitcases, umbrellas, umbrellas | 10.125.690 | 29,49 | 91.393.141 | 13,4 | 1,28 |
| Fibers and yarns of all kinds | 7.943.252 | 18,23 | 78.046.088 | -7,4 | 1,09 |
| Vegetable goods | 8.831.640 | 23,78 | 72.089.456 | 235,47 | 1,01 |
| Rice | 5.227.073 | 15,22 | 63.310.183 | 25,1 | 0,88 |
| Precious stones, precious metals and products | 3.147.049 | 17,11 | 50.466.162 | 63,73 | 0,71 |
| Wires and cables | 2.924.930 | 10,92 | 38.245.075 | -22,08 | 0,53 |
| Toys, sports equipment and parts | 2.980.690 | 13,63 | 26.105.385 | 15,04 | 0,36 |
| Cashew | 2.909.990 | 3,21 | 24.940.992 | 3,22 | 0,35 |
| Paper and paper products | 2.798.956 | 24,43 | 24.238.590 | 192,68 | 0,34 |
| Products from iron and steel | 795.882 | -42,37 | 19.673.362 | 6,4 | 0,27 |
| Chemical products | 1.068.826 | 8,09 | 11.784.875 | 7,41 | 0,16 |
| Other common metals and products | 551.823 | -0,96 | 8.767.918 | -19,86 | 0,12 |
| Confectionery and cereal products | 613.562 | -4,16 | 6.835.738 | 1,33 | 0,1 |
| Wood and wood products | 249.321 | -28,42 | 4.274.016 | -44,57 | 0,06 |
| Furniture made of materials other than wood | 131.153 | -88,91 | 3.548.404 | 57,82 | 0,05 |
| Plastic materials | 554.803 | 87,66 | 2.650.924 | -1,68 | 0,04 |
| Rubber | 227.418 | 67,34 | 2.401.157 | -19,33 | 0,03 |
| Products from rubber | 271.465 | 40,22 | 2.385.997 | -11,86 | 0,03 |
| Ceramic products | 65.693 | 19,58 | 1.186.279 | -24,02 | 0,02 |
| steels | 60.73 | 727.852 | -7,95 | 0,01 | |
| Gasoline of all kinds | 389.137 | 0,01 | |||
| Other goods | 18.390.308 | -16,32 | 234.873.167 | 3,28 |
 Tiếng Việt
  English
  简体中文
简体中文 


