Tiếng Việt


Shipping Vietnam – Korea: Types of shipping, transit time, Import/export duty and procedure
When transporting goods between Vietnam and Korea, you may face one or more of the following issues:
Do not clearly understand state regulations on conditions and required documents when importing goods to Vietnam or exporting goods to Korea to benefit businesses/individuals?
The need to calculate taxes and the time and costs involved in shipping goods from Korea to Vietnam or vice versa.
Are you looking for a reputable, professional freight forwarder / customs broker for your shipment from Korea to Vietnam or from Vietnam to Korea?
With our extensive experience in transporting goods between Vietnam and Korea, this article by HP Global aims to provide guidance and general answers to these questions.
Methods of Cargo Transportation between Vietnam and Korea
Common methods of cargo transportation between Vietnam and Korea include:
- Sea Transportation (FCL/LCL): Transporting goods by sea, most common methods are Full Container Load (FCL) and Less than Container Load (LCL) options.
- Air Transportation
- Express Delivery Services (Courier)
-> Contact us if you need advice on suitable transportation solutions for your shipments. Hotline: ++84 984.870.199 WhatsApp: +8486 5996476 – Email: info@hpgloballtd.com / info@hptoancau.com.
Ocean freight shipping time Vietnam – Korea
Logistics HP Global provide sea freight from all ports in Vietnam to various ports in Korea and vice versal – Hotline: ++84 984.870.199 WhatsApp: +8486 5996476 – Email: info@hpgloballtd.com
Which ports in Korea do goods commonly arrive at for imports from Vietnam? Similarly, which ports in Vietnam do goods usually arrive at for imports from Korea?
Major International Ports in Vietnam and Korea:

| Korea main sea ports | Vietnam’s main sea ports |
| Incheon , Korea ( Port Code: KRINC) | Ho Chi Minh Area (VNSGN HO CHI MINH; VNVUT VUNG TAU; VNCLI CAT LAI; VNCMT CAI MEP) |
| Busan , Korea ( Port Code: KRPUS) | Hai Phong Area (VNHPH HAIPHONG, VNCLH LACH HUYEN…) |
| Gwangyang , Korea ( Port Code: KRKAN) | Da Nang (VNDAD DANANG) |
| Pyeong Taek , Korea ( Port Code: KRPTK) | Quy Nhon (VNUIH) |
In addition, there are other seaports in Korea that engage in cargo import-export with Vietnam, such as:
- SEOUL ( Korea (Republic), Port code:KRSEL)
- TAEGU ( Korea (Republic), Port code:KRTAE)
- TAESAN ( Korea (Republic), Port code:KRTSN)
- ULSAN ( Korea (Republic), Port code:KRUSN)
- PAJU,KOREA ( Korea (Republic), Port code:KRZZZ)
- Chinhae ( Korea (Republic), Port code:KRCHF)
- Masan ( Korea (Republic), Port code:KRMAS)
- Mokpo ( Korea (Republic), Port code:KRMOK)
- Pohang ( Korea (Republic), Port code:KRKPO)
- Tonghae ( Korea (Republic), Port code:KRTGH)
- Ulsan ( Korea (Republic), Port code:KRUSN)
- Yosu (Yeosu) ( Korea (Republic), Port code:KR YOS)
Shipping Containers Between Vietnam and Korea
The table below lists common shipping times for containers between several major international ports in Korea and Vietnam. For more specific information about corresponding services or from other ports in Korea, please contact HP Global’s advisory team at Hotline: ++84 984.870.199 / ++84 886115726 WhatsApp: +8486 5996476 – Email: info@hpgloballtd.com.
| Port name and port code | Sea freight shipping time from Vietnam to Korea (Export from Vietnam to Korea) | Sea freight shipping time from Korea to Vietnam (Export from Korea to Vietnam) | ||||
| Hai phong Area | Da Nang | Ho Chi Minh Area | Hai phong Area | Da Nang | Ho Chi Minh Area | |
| Incheon (KRINC) | 6 – 8 days direct | 7 – 12 days transit | 7 – 11 days direct | 5 – 8 days direct | 9 – 15 days transit | 6 – 9 days direct |
| Busan (KRPUS) | 5 – 10 days direct | 8 – 10 days transit | 5 – 7 days direct | 6 – 9 days direct | 6 – 13 days transit | 5 – 8 days direct |
| Gwangyang (KRKAN) | 10 – 14 days transit | 8 – 12 days transit | 8 – 12 days direct | 6 – 10 days transit | 7 – 12 days transit | 6 – 11 days direct |
| Pyeong Taek (KRPTK) | 6 – 8 days direct 7 – 10 days transit | 9 – 13 days transit | 7 – 8 days direct 6 – 10 days transit | 6 – 9 days direct 12 – 14 days transit | 9 – 15 days transit | 7 – 8 days direct 9 -16 days transit |
In case you do not find the seaport information you need in the table above or want to have the most update information, please do not hesitate to contact us for up-to-date information on shipping times, schedules and shipping quotes from Vietnam to Korea and vice versal – Email: info@hpgloballtd.com
Air cargo transit time: Vietnam – Korea
Transportation time by air from Vietnam to Korea and from Korea to Vietnam?
Which airports in Korea do goods commonly arrive at for imports from Vietnam? Similarly, which airports in Vietnam do goods usually arrive at for imports from Korea?
Logistics HP Global provide air freight from all major airports in Vietnam to various airports in Korea and vice versal – Hotline: ++84 984870199 / ++ 84 86115726
Major International Air Ports in Vietnam and Korea
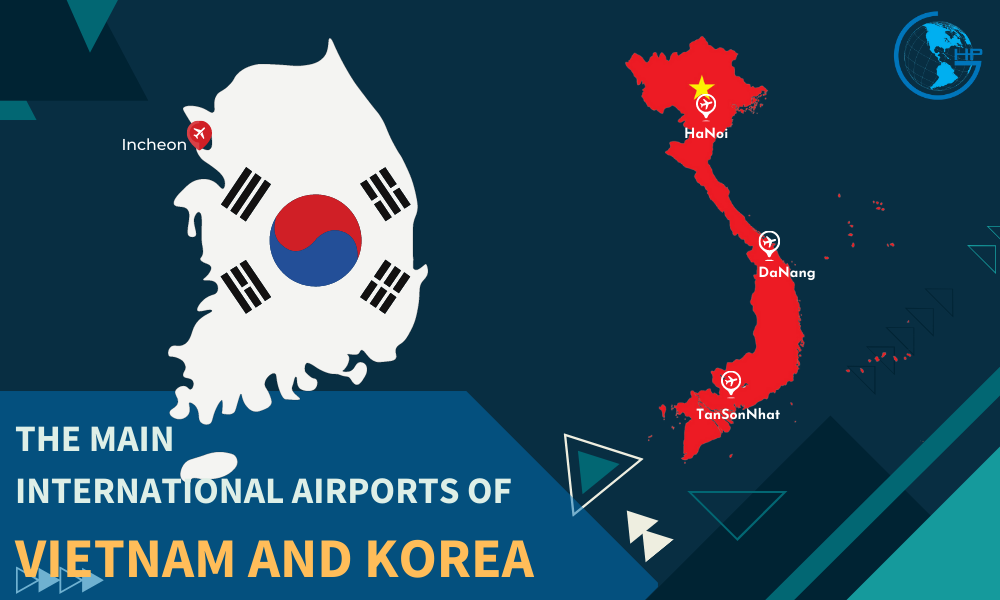
| Major International Airports in Korea | Major International Airports in Vietnam |
| Incheon, Korea ( IATA code: ICN) | Noi Bai – Ha Noi (IATA Code: VNHAN) |
| Da Nang (IATA Code: VNDAD) | |
| Tan Son Nhat – Ho Chi Minh City (IATA Code: VNSGN) |
In addition, there are other airports in Korea that engage in cargo import-export with Vietnam, such as:
- BUSAN NEW PORT ( Korea (Republic), IATA code:BNP)
- KWANGYANG ( Korea (Republic), IATA code:KAN)
- POHANG ( Korea (Republic), IATA code:KPO)
- KWANGJU ( Korea (Republic), IATA code:KWJ)
- MOKPO ( Korea (Republic), IATA code:MOK)
- OSAN ( Korea (Republic), IATA code:OSN)
- Jeju ( Korea (Republic), IATA code:CJU)
- Gimpo ( Korea (Republic), IATA code:GMP)
- Gimhae ( Korea (Republic), IATA code:PUS)
- Cheongju ( Korea (Republic), IATA code:CJJ)
- Daegu ( Korea (Republic), IATA code:TAE)
| For air cargo transportation, if it’s a direct service between Korea airports and Vietnam, the transit time is usually within the day. For transit services (through one or several airports), the duration typically ranges from 1 – 2 days. |
-> See more information about Vietnam’s main airports: Overview of International Airports in Vietnam
In case you do not find the airport information you need in the table above or want to have the most update information, please do not hesitate to contact us for up-to-date information on shipping times, schedules and shipping quotes from Vietnam to Korea and vice versal – Email: info@hpgloballtd.com
Trade relations between Vietnam and Korea
Currently, there are FTAs of VKFTA, AKFTA, RCEP between Vietnam and Korea. Cargo imported from Vietnam to Korea, if meets the requirements of the agreement (C/O, transportation…) can enjoy special preferential import duty, if not, cargo can enjoy preferential import duty.
>> To check the updated legal documents related to special preferential import duty under the above FTA, see in below article: List of FTA Vietnam Joined
→ To check the updated trade relations (MFN, FTAs) between Vietnam and Korea at the article: Overview Of Trade Relations Between Vietnam And The World
- Trade turnover between Vietnam and Korea -> see at: Cargo Transportation Vietnam – Korea
Noticeable Commodities Exported from Vietnam to Korea
HP Global Logistics – Providing International Shipping, Customs Declaration, and Import-Export Licensing Services for Goods between Vietnam & Korea– For specific consultation, feel free to contact our hotline: ++84 886.115.726 or ++84 984.870.199!
List of Noticeable Commodities Exported from Vietnam to Korea
| Commodities | Related Articles |
| Seafood | Procedures for exporting seafood from Vietnam |
| Fruits | Export Procedures for Fruits from Vietnam |
| Coffee | Procedures And Duty For Exporting Coffee From Vietnam |
| Pepper | Procedures for exporting Pepper From Vietnam |
| Wood and wooden products | Procedures And Duty For Exporting Wood and Wood Products From Vietnam |
| Textiles and garments | Procedures for exporting garment fabrics from Vietnam |
| Foot-wears | Procedures And Duty For Exporting Footwear From Vietnam |
For Updated Export Turnover among Commodities From Vietnam to Korea -> See more at link: Cargo Transportation Vietnam – Korea
>> See more “List of taxable export commodity in Vietnam”
- To check import taxes and import procedures for goods from Vietnam to EU countries in general, and Korea specifically, you can use the convenient tool provided by the European Commission through the following link: https://trade.ec.europa.eu/access-to-markets/en/home
Noticeable Commodities Imported into Vietnam from Korea
List of Noticeable Commodities Imported from Korea to Vietnam
| Commodities | Related Articles |
| Aquatic frozen | Import Duty And Procedures For Aquatic frozen To Vietnam |
| Milk | Import procedures milk |
| Fertilizers | Import duty and procedures for Fertilizers to Vietnam |
| Laminated wood floor | Import Procedures for Laminated wood floor to Vietnam |
| Fabrics | Import duty and procedures for Fabrics to Vietnam |
| Auto Parts | Import duty and procedures for Auto Parts to Vietnam |
| Cosmetics | Import Cosmetics to Vietnam: Procedure and Duty |
For Updated Import Turnover among Commodities From Korea to Vietnam -> See more at link: Cargo Transportation Vietnam – Korea
Import Export Duty in Vietnam
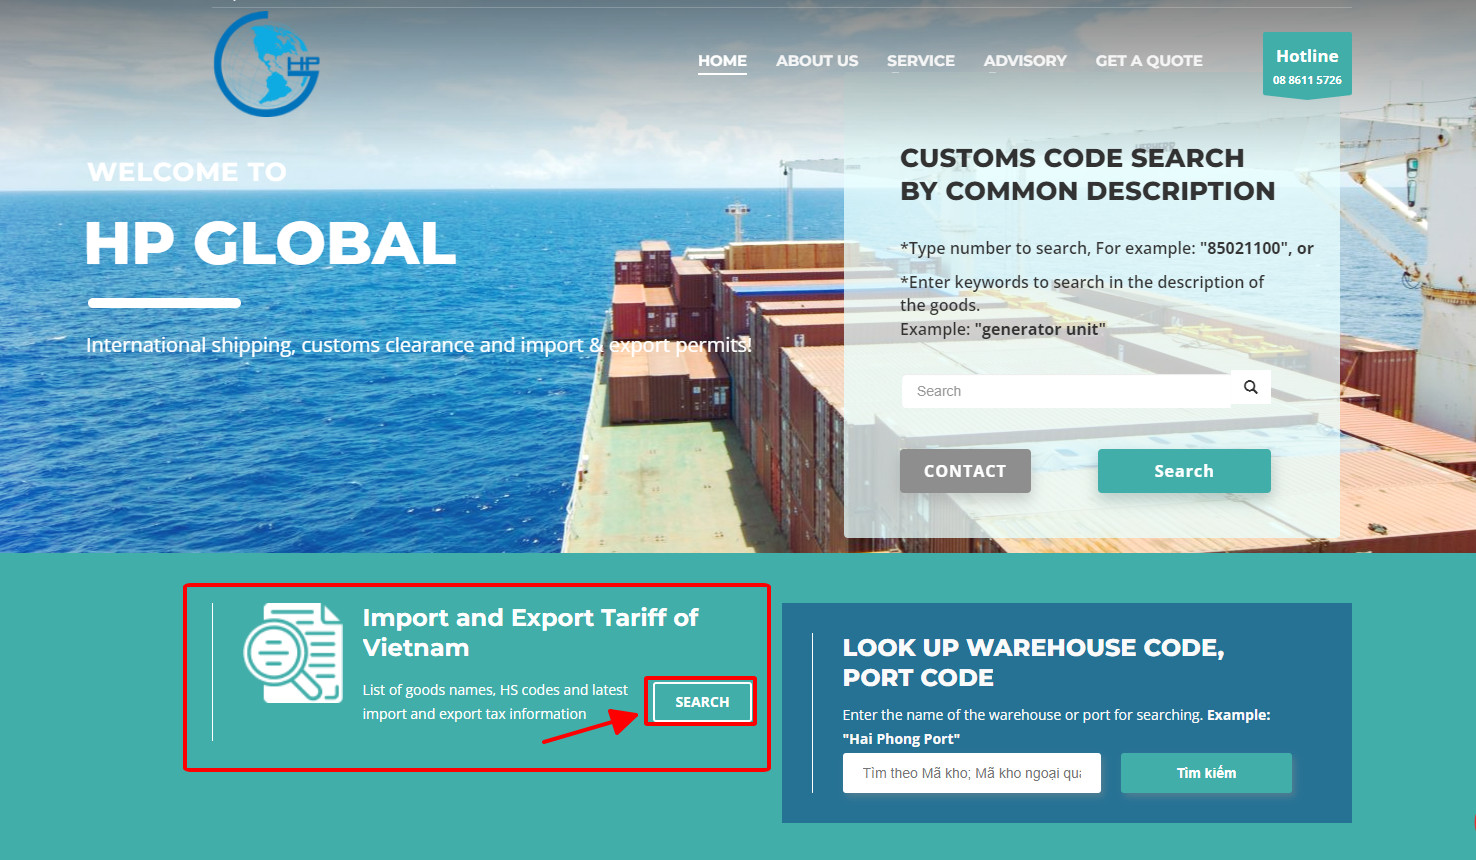
Quick search import export duty for every HS code in Vietnam
To check the update import duty / export duty for cargo import to / export from Vietnam to Korea, you can contact HP Global via email info@hpgloballtd.com or hotline ++84 886115726 / ++84 984870199 or search on website hptoancau.com as instructed in the image below
The Procedure for Cargo Transporting Between Vietnam and Korea
Once the goods are ready for delivery at the exporter’s warehouse, the standard process for transporting a shipment includes the following steps:
Step 1: Transport from the exporter’s warehouse to the export port.
Step 2: Export customs clearance.
Step 3: Cargo loading and unloading at the port.
Step 4: International transportation.
Step 5: Import customs clearance (note: certain items require permits, declarations, quality inspections, etc., to meet the customs clearance criteria).
Step 6: Cargo handling at the import port.
Step 7: Transporting goods from the warehouse/port to the importer’s warehouse.
HP Global Provides Shipping Services for Goods between Vietnam and Korea
With years of experience in shipping goods between Vietnam and Korea, handling thousands of shipments annually, we confidently deliver professional and optimal management to you. We are committed to advising and providing you with transportation solutions that match the best market prices.
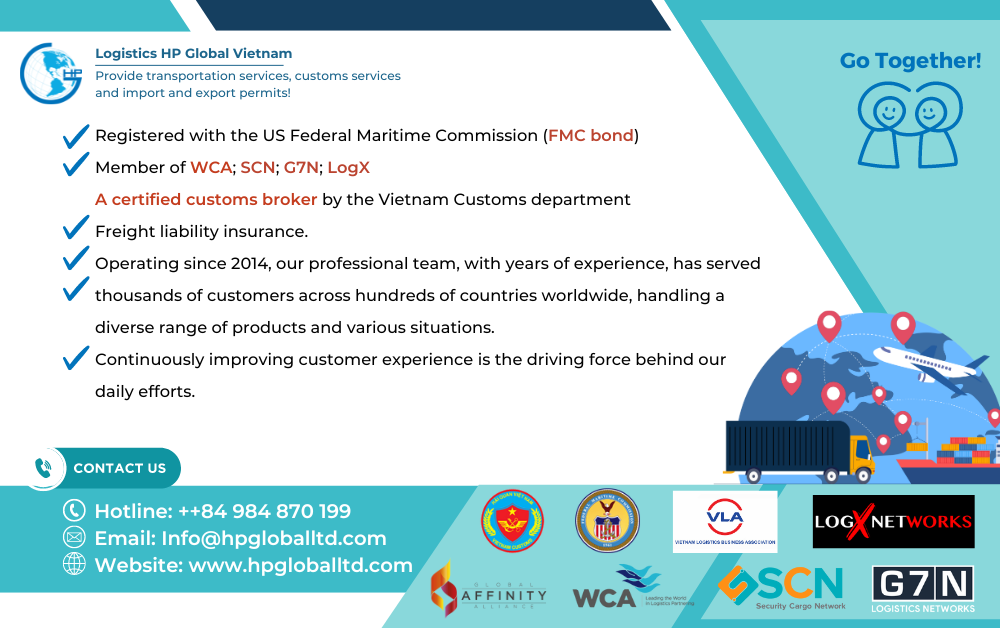
HP Global is a freight forwarder with a top reputation in Vietnam.
→ Contact us for freight and inbound and outbound services for shipments to/from Vietnam – Email: info@hpgloballtd.com
Logistics HP Global Vietnam
Freight forwarder, Customs Broker and Vietnam Import/export license
Building No. 13, Lane 03, N003, Van Khe, La Khe, Ha Dong, Hanoi
Website: hpgloballtd.com / hptoancau.com
Email: info@hpgloballtd.com
Phone: ++84 24 73008608 / Hotline: ++84 984870199/ ++84 8 8611 5726/ Whatsapp: ++84 865996476
Note:
– The article is for reference only, prior to using the content, it is suggested that you should contact HP Global for whether any update
– HP Global keep it full right copy right of the article. No copy for commercial purpose is approved.
– Any copy without approval by HP Global (even note quote from website hpgloballtd.com/hptoancau.com) can cause to our claim to google and related agencies.